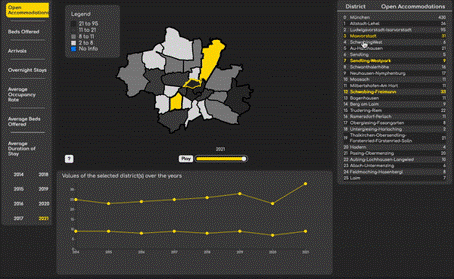
Impact of Covid on on the accommodation industry in the individual districts of Munich
Accommodation industry in Munich from 2014-2021
Source: Statisches Amt München

The MAP
•Districts mapped to area on map 🡪 mark = area
•Values separated by quartiles 🡪 same color = same quartile
•Grayscale with four quartiles 🡪 channel = lightness
•Separate blue color for districts with no data 🡪 channel = color
•Selected districts colored in yellow 🡪 channel = color
•Hovered districts outlines in yellow 🡪 channel = color
The Interaction
•Legend: Click/Hover over quartiles to compare
•Map: Click/Hover over districts to get value and compare over time
•Timeline: select to get value of specific year
•Time Scale: press play and an animation displays the changes over the years on the map
•Table: Click/Hover over districts to see position in map and compare over time
•Line Chart: Hover over line to see position in map; Hover over data point to see value
•Help Button: the different categories available gets explained here


